
Master MCAT waves and sound concepts including frequency, wavelength, amplitude, Doppler effect, and resonance. Includes practice questions with detailed answers.

(Note: This guide is part of our MCAT Physics series.)
Part 1: Introduction to waves and sound
Part 2: Characteristics of periodic motion
a) Amplitude
b) Frequency
c) Phase
Part 3: Sound
a) Transverse and longitudinal waves
b) Sound production
c) Sound intensity
Part 4: Wave Phenomena
a) Doppler effect
b) Shockwaves
c) Resonance
Part 5: High-Yield Terms and Equations
Part 6: Passage-based questions and answers
Part 7: Standalone questions and answers
----
Part 1: Introduction to waves and sound
Periodic motion is an important concept that shows up in a wide range of topics. Conceptually, periodic motion occurs as a result of many common forces and potentials. Mathematically, it presents a great opportunity to practice wave graphs, which are incredibly powerful and versatile tools of analysis. Graphical depiction of periodic motion is identical to that of sound, which is itself a slightly different example of a wave. Mastering these concepts will help you understand many basic systems as well as waves and their characteristics. On the MCAT, periodic motion and sound are medium-yield topics.
Receive a free MCAT Question of the Day—written by a 528 scorer
Get every last bit of practice in before test day with a free MCAT question delivered straight to your inbox daily.
----
Part 2: Characteristics of periodic motion
Periodic motion is any motion that repeats itself. Common examples are pendulums, bobbing springs, and skateboarders going up and down a halfpipe. Graphs are especially helpful when working with periodic motion, because it’s easy to see the repeating patterns when they are represented visually. The most natural shape for periodic motion is a sine wave, but it’s possible to see other shapes as well, including triangle waves, square waves, or completely irregular waves.
When graphing periodic motion, displacement is usually on the y-axis and time is on the x-axis.

Figure 1 Examples of periodic waves
There are three values that define periodic motion: its amplitude, frequency, and phase. Any regular form of periodic motion can be defined through these three variables only. We’ll discuss each in further detail.
a) Amplitude
If something is undergoing periodic motion, its amplitude is its maximum displacement from rest (or displacement=0). For example, imagine a weight hanging from a spring. Starting from rest, the weight can be pulled down to initiate a bobbing motion. The amplitude would be the distance from the weight’s highest point to the middle point.

Figure 2 Amplitude of a sine wave.
This middle point, or when displacement is equal to zero, is often called the object’s equilibrium position. On a graph, the amplitude describes the height of the peaks and the depths of the troughs. Amplitude is always given in units of a displacement. This means meters when the displacement is a distance, or radians or degrees when the displacement is an angle.
b) Frequency
On a graph, you can qualitatively describe the frequency by how dense the peaks are. Waves that appear to be denser have higher frequencies. However, it’s important to check that the time scale on each x-axis is represented on the same scale!

Figure 3 Wave 1 has higher frequency than wave 2.
To calculate the frequency from a graph, first measure the period of oscillation: the length of one complete cycle, by measuring from one peak to another. The period is the reciprocal of frequency (or P=1/f), so you can find the frequency simply by dividing 1 by the measured period.

Figure 4 Frequency is the reciprocal of the period.
You can also use the frequency and wavelength to determine the velocity of a wave.
where v = velocity of the wave,
f = frequency,
λ = wavelength
The angular frequency is how many radians are passed through in one second. To convert linear frequency to angular frequency, multiply by 2π. This is because there are 2π radians per rotation.
c) Phase
Phase refers to the relationship between two different waves. Two waves are in phase if their maxima and minima occur at the same points in time. When adding waves that are in phase with one another, they will constructively interfere: their maxima will add to become an even greeted maximum, and so will minima. The equilibrium position should remain the same.
Waves are out of phase if their peaks do not line up exactly and are perfectly out of phase if the peaks of one wave occur at the same time as the troughs of the other. When waves get more and more out of phase, they interfere more destructively. When waves are perfectly out of phase, two waves of the same magnitude will cancel each other out completely and sum to a wave of zero amplitude.

Figure 5 Waves In phase and perfectly out of phase.
To try and visualize this, imagine a system made of one spring attached to a wall and a system made of two other identical springs also attached to a wall. Pressing a block 1 cm into the one-spring system will cause the block to slide back and forth with an amplitude of 1 cm.
In the two-block system:
The oscillation of the springs will be in phase if you press a block into the springs such that both are compressed 1 cm. They will interfere constructively, and the total amplitude of the block’s motion will be 2 cm.
The springs will be out of phase if you compress one 1 cm and compress the other 1 cm after releasing the block (sounds hard to do in real life, but we can still think about it!). The total amplitude of the block’s motion will be less than 2 cm.
The springs will be perfectly out of phase if you compress one 1 cm and stretch the other 1 cm. The total amplitude of the block’s motion will be 0 cm.
Note that waves can be in and out of phase if they have different amplitudes. Phase differences will tell you how to add them.
----
Part 3: Sound
Like periodic motion, sound can be represented by waves. However, it requires a little extra thought to see how they can both be conceived in this way.
To begin with, while periodic motion only becomes a wave when we look at motion over time, sound is a wave in both time and space. This means that you could keep track of a single position over a period of time (like what we do for periodic motion) or take a picture of a region of space, and both measurements would give you some sort of wave-like data.
To begin with, we’ll discuss what a snapshot of sound looks like in space.
a) Transverse and longitudinal waves
Most waves you will encounter are transverse waves, which are waves with displacement perpendicular to the axis of motion. Examples are waves in water and electromagnetic waves, such as light.
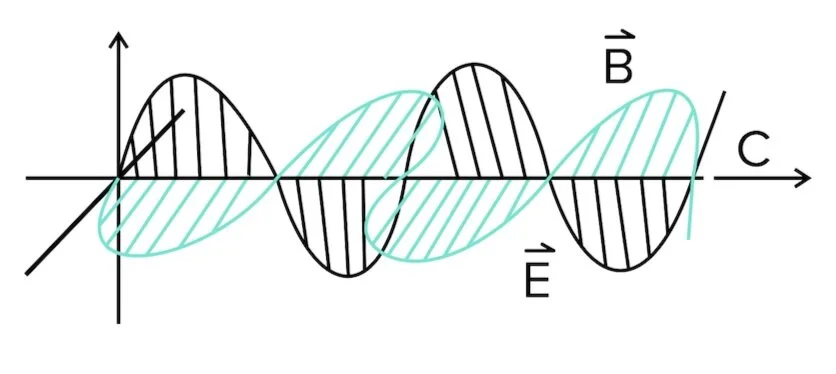
Figure 6 Light is a transverse wave
Longitudinal waves, on the other hand, are waves whose displacements are parallel to the direction of motion. Imagine holding a Slinky in the palm of your hand and repeatedly pushing it out along a tabletop. The motion of the Slinky would travel in the same direction as the pushing itself.
Sound is a longitudinal wave. In space, sound looks like a collection of parallel lines moving in unison.
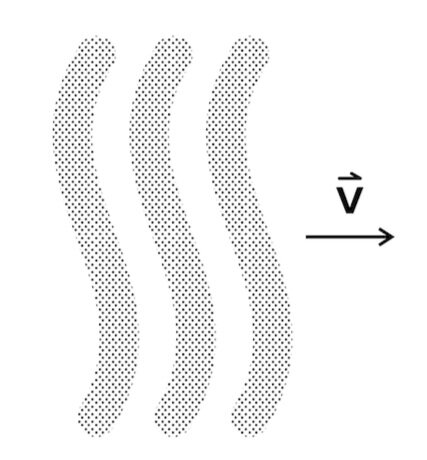
Figure 7 A sound wave propagating through molecules in space.
This picture looks very different from other waves we’ve talked about, so how can we say they’re related at all? The answer is that we should graph the density of the particles. This gives the familiar wave shape.
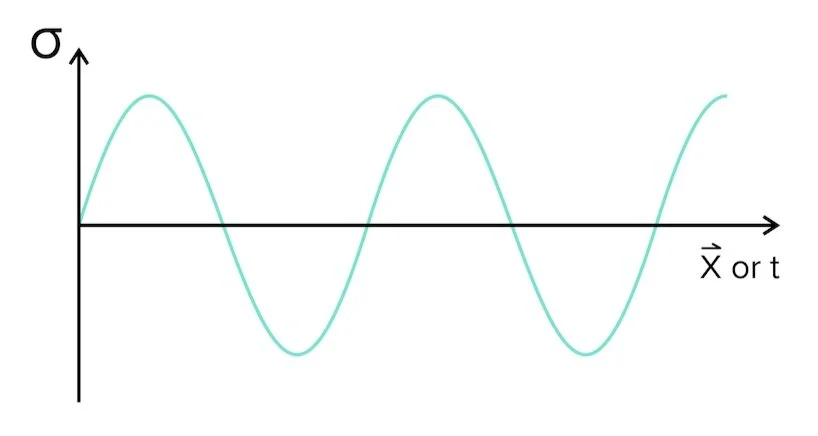
Figure 8 A density wave that describes the movement of the sound wave above.
Note that the image above is a graph of density versus position along the x-axis. It is also possible to graph the density versus time; you just have to remember what you’re doing: measuring the density at a single point in space over a period of time.
When the horizontal axis represents displacement, you can use the density graph to directly measure wavelength. When the horizontal axis is time, you can use the graph to directly measure the period.
b) Sound production
Sound waves are created by vibrating objects. By “pushing” and “pulling” particles in the surrounding medium, the vibrations create high- and low-density packets (the peaks and troughs) that travel away from the origin. This means that in a vacuum, where there is no medium to be pushed and pulled, sound cannot be produced. This is why there is no sound to be heard in space!
Human ears have evolved to detect only a relatively small range of frequencies. When a vibration’s frequency is too low to hear, it is called infrasound. Likewise, when its frequency is too high to hear, it is called ultrasound.
Ultrasound can be used for imaging. A source shoots out ultrasound waves, which are then reflected back into the source. By analyzing the time it took for waves to return to the sensor, the device can map the targeted area. This is a very common technique used for biomedical imaging.
When atoms in a medium are more tightly bound together, disturbances in them are able to propagate more quickly. For this reason, the speed of sound varies in different materials. As a general rule of thumb, sound travels fastest in solids, then liquids, then gasses. This is because rigidity increases the relative speed of sound, and compressibility decreases it.
In addition to rigidity, the speed of sound also somewhat depends on density and temperature. Sound travels faster in less dense mediums and mediums that are hotter.
c) Sound intensity
Sound level is measured in decibels (represented as dB or):
where β = decibels,
log10 = logarithm of base 10,
I = the intensity of the sound,
I0 = 10−12 W/m2
In this equation, I0 is the lowest perceptible sound to the human ear.
The decibel scale seems a bit strange, but that is because it was designed to describe how humans actually perceive sound. A sound with dB = 0 is by definition inaudible to humans. Just above that, human ears are relatively perceptive to changes in intensity but are much less perceptive to the difference between very high-intensity sounds.
Attenuation refers to the gradual dampening of sound intensity as it propagates through a material. Attenuation occurs most quickly in materials that are compressible, elastic, viscous, and less dense. This phenomenon explains why big, fluffy earmuffs are effective at silencing noises around you.
Moving Sound Source or Observer
Not ready to commit to your MCAT prep at this time?
Enter your name and email for a free MCAT question delivered straight to your inbox daily.
----
Part 4: Wave phenomena
a) Doppler effect
When a police car zooms past you with sirens blaring, the perceived sound increases in pitch as it approaches, then decreases in pitch after it passes. Pitch is how humans perceive sound frequency–a higher frequency has a higher pitch. This is the Doppler effect.
The Doppler effect describes a change in frequency of a wave that is the result of a relative motion between a wave source and its observer. The frequency shift can be described through the following equation:
where f' = the observed frequency,
v = speed of sound in given medium,
v0 = speed of the observer,
vs = speed of the source,
f = the actual frequency
You may be tested on many different scenarios involving the Doppler effect, but they can be generally summarized as this: when the distance between observer and emitter is decreasing, frequency is increasing, and when the distance between observer and emitter is increasing, frequency is decreasing.
The Doppler effect is directly applicable to echocardiography. In echocardiography, a sound wave is emitted from a stationary transducer, which then records the waves that bounce back off of objects such as erythrocytes. Even with the reflection, the Doppler effect is in effect the same: decreasing distance means increasing frequency, and vice versa. You may see this concept applied to measuring blood flow, observing galaxies move across the universe, and more.
b) Shock waves
You may have heard about shock waves and sonic booms. What are they, and how are they produced?
Shock waves occur when sound waves are bunched up at one point in space. Recall that sound waves are transmitted through the medium. A special case occurs when an object emitting sound actually travels faster than the local speed of sound. This often occurs with high-speed airplanes.
At the moment the plane reaches the speed of sound, all of the sound waves it emits over that period of time are in the same place, creating a super-dense shock wave. These are called sonic booms, and they are why some planes are so loud and project a cone-shaped cloud around them.
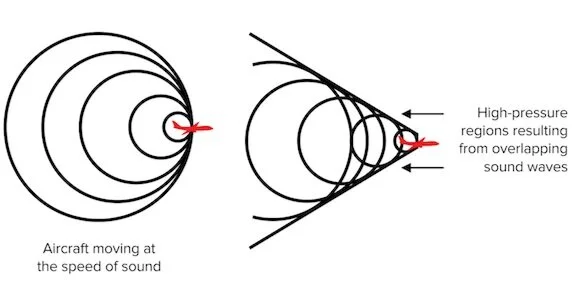
Figure 9 A sonic boom
c) Resonance
Resonance is a phenomenon that occurs when waves oscillate in a space that is equal in length to some multiple of the wave’s wavelength. As a result, the amplitude of the wave increases dramatically.
Standing waves in strings achieve resonance when nodes (the points where the amplitude is zero) line up with the two fixed ends of the string. This happens whenever the distance between tether points equals a multiple of one-half of the wavelength. (The frequency is called the fundamental frequency when half of its wavelength is exactly the length of the string.) The equation is
where L = the distance between endpoints of the string,
n = some integer multiple,
λ = wavelength
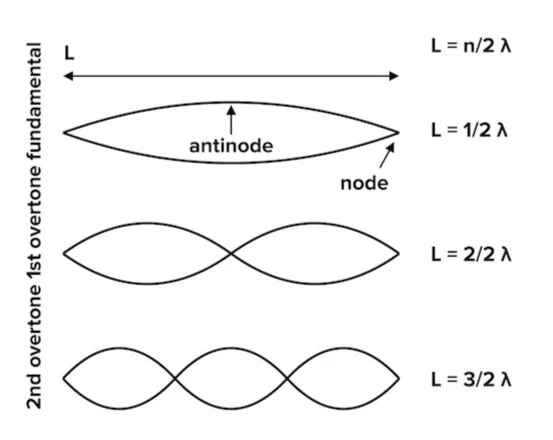
Figure 10 Resonance in a string.
A similar phenomenon occurs when soundwaves in pipes with two open sides resonate. Resonance is achieved in a pipe with one open side when the distance from the opening to the opposite side and back is equal to one-half the wavelength. In other words, resonance occurs when the length of the tube is an odd multiple of 1/4 of the wavelength.
where L = the distance between endpoints of the string,
n = some integer multiple,
λ = wavelength
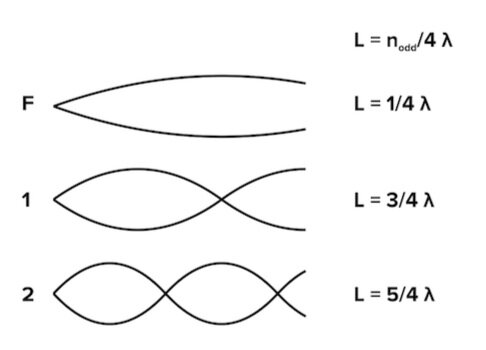
Figure 11 Resonance in a tube with one open end.
----
Part 5: High-yield terms
Periodic motion: any motion that repeats itself
Amplitude: maximum displacement from rest (or displacement=0); always given in units of a displacement
Equilibrium position: point in space at which an object’s displacement is equal to zero
Frequency: simple harmonic motion quantifies how many cycles occur in one second
Period of oscillation: the time it takes to complete one full cycle of harmonic motion
Angular frequency: how many radians are passed through in one second
Transverse waves: waves with displacement perpendicular to the axis of motion; examples include waves in water and electromagnetic waves
Longitudinal waves: waves with displacement parallel to the direction of motion; examples include sound waves
Attenuation: gradual dampening of sound intensity as it propagates through a material
Doppler effect: describes a change in frequency of a wave that is the result of a relative motion between a wave source and its observer
Resonance: a phenomenon that occurs when waves oscillate in a space that is equal in length to some multiple of the wave’s wavelength
Equations
Velocity of sound: v = f × λ
Decibel scale: β = 10 log(I/I0), I0 = 10−12 W/m2
Doppler effect: f′ = ((v + v0)/(v − vs)) × f
Resonance in strings and open tubes:
L = (n/2) × λ
Resonance in tubes with one open one closed end:
L = ((2n − 1)/4) × λ
----
Part 6: Passage-based questions and answers
Diagnostic ultrasounds are used for non-invasive imaging of internal organs. Other applications include Doppler and color Doppler ultrasounds, used for analyzing blood flow, elastography, (which distinguishes tumors and healthy tissue by measuring relative stiffness), and therapeutic ultrasound such as High Intensity Focused Ultrasound (HIFU) (which can be used to heat, ablate, or break up harmful tissue such as tumors).
When ultrasounds are used to produce images, blood and internal organs reflect high frequency waves produced by the transducer. The transducer then detects echoes from these sound waves, signaling to the ultrasound scanner where different portions of sound waves are being reflected. The scanner uses this information to produce a two-dimensional image of the scanned area. During ultrasound exams, a gel is applied to the patient’s skin to prevent air pockets from forming between the transducer and the skin. Otherwise, the ultrasound beam may disperse in any air pockets.
In one particular ultrasound exam, a physician performs a Doppler ultrasound to look for evidence of plaque build-up in the carotid arteries that might be blocking blood to the brain. Below are the original and reflected ultrasound beam frequencies when pointed at each:
Table 1 Results of Doppler ultrasound exam
| Output Frequency | Reflected Frequency | |
|---|---|---|