Ivy League Acceptance Rates 2026: What You're Up Against
Ivy League admissions statistics for the Class of 2030 and strategies to get in despite intense competition
Ivy League acceptance rates are trending lower each year
----
Part 1: Introduction
Ivy League acceptance rates are of great interest given that the eight universities—Brown, Columbia, Cornell, Dartmouth, Harvard, Penn, Princeton, and Yale—routinely rank among the best in the world. Each year, hundreds of thousands of students with perfect or near-perfect grades and test scores submit their applications hoping to get into one or more of these elite schools.
The admissions statistics for the past couple of years are sobering. Despite a very slight uptick in acceptance rates from the class of 2028 and the class of 2029, this year’s class of 2030 saw a trend in the other direction, with every Ivy League institution to have reported their admissions data revealing a decrease in acceptance rates.
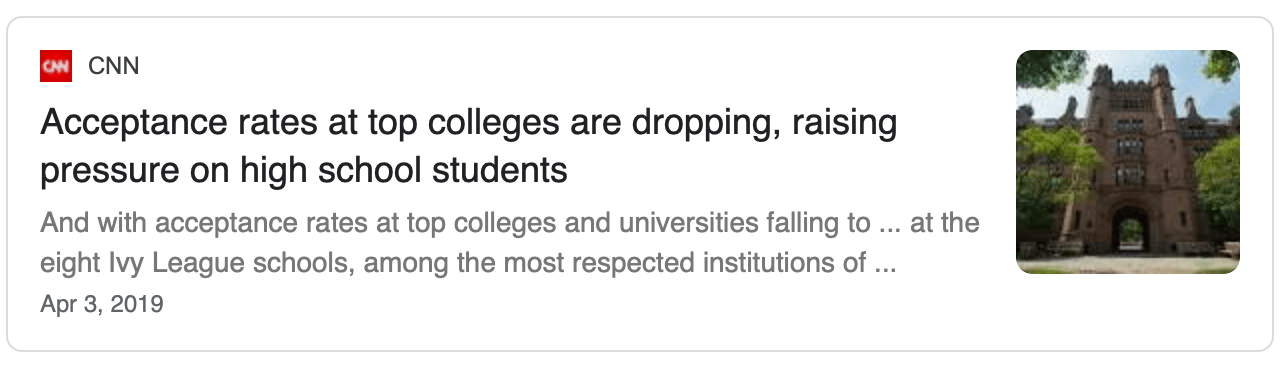
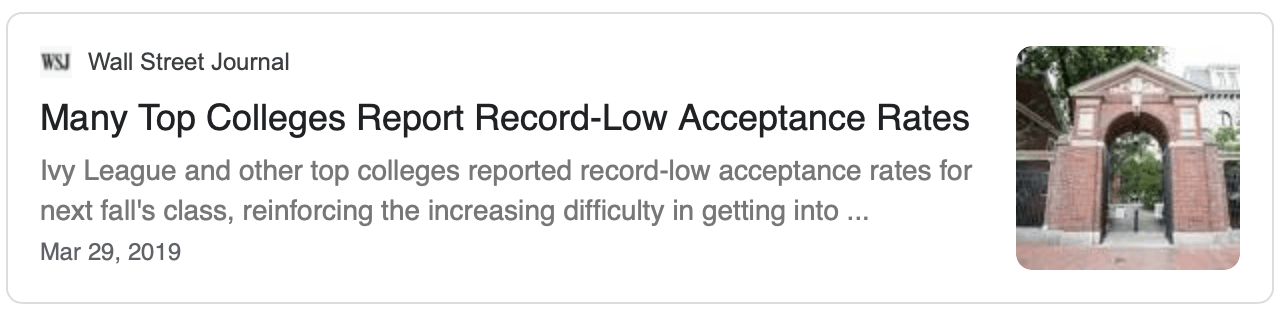
For years, Ivy League admissions data have triggered annual headlines in major publications, which reinforce the exclusivity and selectivity of Ivy League schools. Here are a few examples:
Rather than accept defeat before your child ever applies to the Ivy League, it’s important to understand the numbers at each individual school. Below, we’ll go over the most recent admissions statistics and discuss key takeaways. Then we’ll review the strategies your child can employ to maximize their chances of Ivy League admission in future application cycles.
Want to know exactly what it takes to get into America's most selective colleges?
Get our free 110-page guide we use to help our students routinely get admitted to schools like Harvard, Yale, and Stanford: How to Get into America's Elite Colleges: The Ultimate Guide
----
Part 2: Ivy League acceptance rates: Class of 2029
(Note: This table will be updated as new data are released. Several schools are continuing to delay the release of all or part of their acceptance data at this time.)
| Overall Acceptance Rates | Early Action/Early Decision Acceptance Rates | Regular Decision Acceptance Rates | |||||||
| Accepted | Applied | Acceptance Rate | Accepted | Applied | Acceptance Rate | Accepted | Applied | Acceptance Rate | |
| Brown* | 2,564 | 47,937 | 5.35% | 890 | 5,406 | 16.5% | 1,674 | 42,531 | 3.94% |
| Columbia* | 2,586 | 61,031 | 4.23% | - | 5,497 | - | - | - | - |
| Cornell* | 5,776 | - | - | - | - | - | - | - | - |
| Dartmouth* | 1,687 | 28,863 | 5.8% | - | - | - | - | - | - |
| Harvard^ | - | - | - | - | - | - | - | - | - |
| Penn* | - | >61,000 | - | - | 7,800 | - | - | - | - |
| Princeton^ | - | - | - | - | - | - | - | - | - |
| Yale^ | 2,328 | 54,919 | 4.24% | 779 | 7,140 | 10.9% | 1,431 | 46,494 | 2.9% |
| Total | - | - | - | - | - | - | - | - | - |
*Early decision schools | ^Single-choice early action schools
----
Part 3: 2026 Ivy League acceptance rates takeaways
The “Big Three” Ivy League schools, plus Columbia, are likely the most selective
Harvard, Princeton, and Yale—known as the “Big Three”—are historically the three toughest Ivy League schools to get into. In recent years, they have been joined by Columbia in the top half of the Ivy League schools in terms of selectivity. Although Princeton and Harvard’s 2026 admissions data is not yet public, we expect this trend to continue.
In 2021, Columbia edged past Princeton and Harvard to become the most competitive Ivy. A few years later, with an acceptance rate of 3.59%, Harvard reclaimed its position as the hardest Ivy League school to get into. However, with Harvard delaying the reporting of its class of 2030 acceptance data, Columbia (4.23%) and Yale (4.24%) are currently positioned as the most competitive out of those that did report data.
Last year, Harvard decided to hold off on releasing admissions data until the fall, when it must report to the Department of Education. It appears that the school will follow the same procedure for the Class of 2030. That said, Harvard has accepted anywhere between 1,085 and 1,245 regular decision applicants over the past five years.
For the class of 2029, Yale’s acceptance rate was 4.6%, up slightly from its steady decline over the previous six years. However, for the class of 2030, it has once again fallen to 4.24%, virtually tying it with Columbia (4.23%) for the second-lowest acceptance rate out of all the Ivies.
Last year, Dartmouth reported a record high number of early decision applicants, but for the class of 2030, they have yet to share this data. Overall, they’ve experienced a steady increase in volume of applications for the past six years, with a 2.24% increase since last year alone. This is the sixth consecutive year the school has received over 28,000 applications. But despite this rise in number of applications, the acceptance rate actually decreased by about 0.88%. To date, the class of 2030 represents a 34.91% increase over the number of applications in 2020. Still, it remains the Ivy with the highest acceptance rate (5.8%) among the schools that have currently released data for this cycle.
Brown’s acceptance rate of 5.35% makes it the second-highest acceptance rate among the Ivies this year, although it is trending downward from last year’s rate of 5. Applicants who opted for Early Decision enjoyed an acceptance rate three times higher (16.5%) than the overall rate of just 5.35%.
Compared to last year, Penn experienced a 15.28% drop in the number of applications received, likely due to the fact that it reinstated its requirement for standardized testing this cycle. It has not yet released data on the number of acceptances for the class of 2030.
While Cornell doesn’t publish the total number of applicants, they report that 5,776 were accepted into the class of 2030, a slight decrease of 0.82% compared to the class of 2029. This is a significant trend in the opposite direction from the previous year, which saw a 13.3% increase in acceptances between the class of 2028 and the class of 2029.
Three years ago, acceptance rates for all Ivy League schools dipped into the single digits for the first time, and the average acceptance rate across all eight schools was 5.4%. While the full picture for 2026 isn’t yet available, here is a partial list of the Ivy League schools in ascending order of overall selectivity:
Columbia (4.23%)
Yale (4.24%)
Brown (5.35%)
Dartmouth (5.8%)
Selectivity is highly associated with Ivy League rankings; that is, the highest-ranked schools tend to have the lowest acceptance rates.
Early action and early decision applicants enjoy higher acceptance rates
It’s widely known that students who apply early action or early decision typically get accepted to Ivy League schools (and others, like Stanford and MIT) at significantly higher rates than regular decision applicants.
For instance, whereas 16.5% of early decision applicants got into Brown this year (2026), only 3.94% of regular decision applicants were accepted. Both of these statistics tell a different story from Brown’s overall acceptance rate of 5.35%.
However, this is not the case for every Ivy. The difference between the two types of acceptance rates has fallen in recent years at Harvard, where for the class of 2028 only 8.74% of early action applicants received an offer of admission. While that number is more encouraging than the mere 2.7% of regular decision applicants who got in that year, the difference is far less pronounced than in previous years (in 2020, Harvard’s early action and regular decision rates were 13.9% and 3.3%, respectively).
Nevertheless, if your child knows that one of the Ivy League schools is their top choice, they should strongly consider applying early action or early decision to maximize their odds of getting in. Applying early demonstrates strong interest and is attractive to schools who want to protect their yield rate.
At the same time, it’s important to remember the following confounding variable: the early action and early decision applicant pool tends to be stronger than the regular decision pool. Therefore, it’s difficult to quantify the impact of applying early vs. the impact of a higher-achieving group of early applicants.
(Suggested reading: Early Action vs. Early Decision: Pros and Cons and What Your Child Should Do)
Getting into an Ivy League school is incredibly difficult
When we evaluate which Ivy League schools are “easiest” or “toughest” to get into, it’s easy to miss the big picture: Ivy League universities are some of the most selective in the country. Given the low overall acceptance rate, the vast majority of Ivy League applicants will not get into any of the eight schools.
While this is a tough pill to swallow, it reinforces our recommendation to create a balanced college list. Specifically, high-achieving students should consider Ivy League schools as part of an overall admissions strategy that includes reach, target, and safety schools, rather than as their exclusive focus.
At the same time, Ivy League acceptance rates are misleading in another way: odds of getting in are not the same for everyone. For instance, a student with a 4.0 GPA, 36 ACT score, and outstanding extracurricular activities does not have has the same chance of getting in as a student with a 3.7 GPA, 1420 SAT score, and above-average extracurricular profile. The former student’s odds of getting in are much higher than the overall acceptance rate, whereas the latter student’s chances are lower.
Want to learn more about getting into specific Ivy League schools?
With the increasing number of applications and high level of achievement among America’s high school students, Ivy League acceptance rates are likely to remain low during the foreseeable future.
While these admissions statistics can be disheartening, your child can get into Ivy League and other elite schools through high academic achievement, standout extracurricular activities, and writing great college essays (e.g., the Common App Essay and supplemental essays).
However, every Ivy League school is different and maximizing your child’s odds of getting into each one will require slightly different approaches. Click below to learn more school-specific strategies:


You may also be interested in the following guides to getting into Ivy+ schools:

About the Author
Dr. Shirag Shemmassian is the Founder of Shemmassian Academic Consulting and one of the world's foremost experts on college admissions. For over 20 years, he and his team have helped thousands of students get into top programs like Harvard, Stanford, and MIT using his exclusive approach.
Ready to schedule a consultation?
THERE'S NO REASON FOR YOUR CHILD TO APPLY TO IVY LEAGUE SCHOOLS ALONE, ESPECIALLY WITH SO MUCH ON THE LINE. CLICK BELOW TO SCHEDULE A COMPLIMENTARY CONSULTATION TODAY TO ENSURE YOU LEAVE NOTHING TO CHANCE
----
Appendix: Previous Ivy League acceptance rates
Ivy League acceptance rates: Class of 2029
| Overall Acceptance Rates | Early Action/Early Decision Acceptance Rates | Regular Decision Acceptance Rates | |||||||
| Accepted | Applied | Acceptance Rate | Accepted | Applied | Acceptance Rate | Accepted | Applied | Acceptance Rate | |
| Brown* | 2,418 | 42,765 | 5.65% | 907 | 5,055 | 14.38% | 1,508 | 37,710 | 4% |
| Columbia* | 2,557 | 59,616 | 4.29% | - | 5,872 | - | - | 53,744 | - |
| Cornell* | 5,824 | - | - | - | - | - | - | - | - |
| Dartmouth* | 1,702 | 28,230 | 6.03% | - | 3,550 | - | - | 24,680 | - |
| Harvard^ | - | - | - | - | - | - | - | - | - |
| Penn* | 3,530 | 72,544 | 4.9% | - | over 9,500 | - | - | ~63,000 | - |
| Princeton^ | - | - | - | - | - | - | - | - | - |
| Yale^ | 2,308 | 50,228 | 4.6% | 728 | 6,729 | 10.8% | - | 43,499 | - |
| Total | - | - | - | - | - | - | - | - | - |
*Early decision schools | ^Single-choice early action schools
Ivy League acceptance rates: Class of 2028
| Brown* | |||||||||
| Columbia* | |||||||||
| Cornell* | |||||||||
| Dartmouth* | |||||||||
| Harvard^ | |||||||||
| Penn* | |||||||||
| Princeton^ | |||||||||
| Yale^ | |||||||||
| Total | |||||||||
Ivy League acceptance rates: Class of 2027
| Brown* | |||||||||
| Columbia* | |||||||||
| Cornell* | |||||||||
| Dartmouth* | |||||||||
| Harvard^ | |||||||||
| Penn* | |||||||||
| Princeton^ | |||||||||
| Yale^ | |||||||||
| Total | |||||||||
Ivy League acceptance rates: Class of 2026
(Note: Cornell, Penn, and Princeton have declined to publish admissions data at this time.)
| Brown* | |||||||||
| Columbia* | |||||||||
| Cornell* | |||||||||
| Dartmouth* | |||||||||
| Harvard^ | |||||||||
| Penn* | |||||||||
| Princeton^ | |||||||||
| Yale^ | |||||||||
| Total | |||||||||
Ivy League acceptance rates: Class of 2025
(Note: Princeton cancelled early action for the class of 2025.)
| Brown* | |||||||||
| Columbia* | |||||||||
| Cornell* | |||||||||
| Dartmouth* | |||||||||
| Harvard^ | |||||||||
| Penn* | |||||||||
| Princeton^ | |||||||||
| Yale^ | |||||||||
| Total | |||||||||
Ivy League acceptance rates: Class of 2024
| Brown* | |||||||||
| Columbia* | |||||||||
| Cornell* | |||||||||
| Dartmouth* | |||||||||
| Harvard^ | |||||||||
| Penn* | |||||||||
| Princeton^ | |||||||||
| Yale^ | |||||||||
| Total | |||||||||
Ivy League acceptance rates: Class of 2023
| Brown* | |||||||||
| Columbia* | |||||||||
| Cornell* | |||||||||
| Dartmouth* | |||||||||
| Harvard^ | |||||||||
| Penn* | |||||||||
| Princeton^ | |||||||||
| Yale^ | |||||||||
| Total | |||||||||
Want to know exactly what it takes to get into America's most selective colleges?
Get our free 110-page guide we use to help our students routinely get admitted to schools like Harvard, Yale, and Stanford: How to Get into America's Elite Colleges: The Ultimate Guide